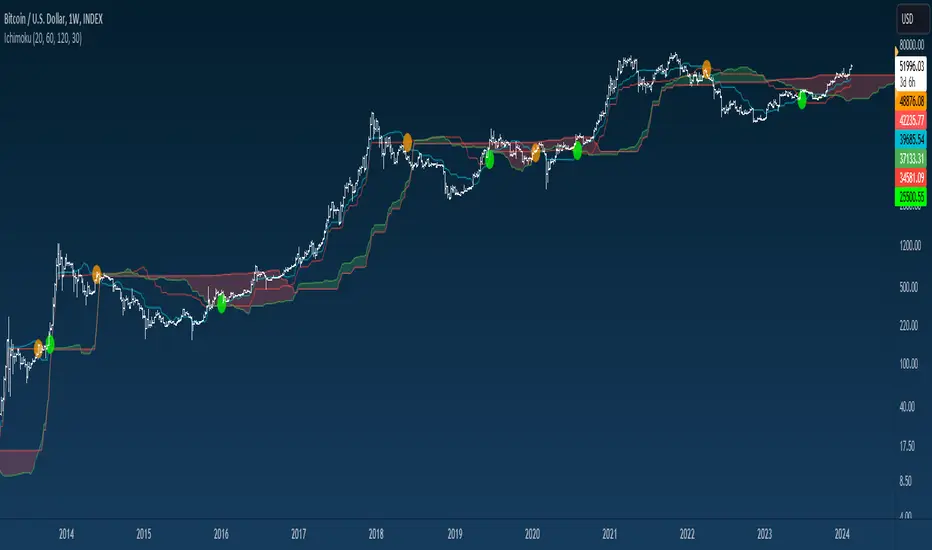
Crypto IchimokuIchimoku Cloud with settings recommended for crypto by trader IAmSatoshi. Includes a handy checkbox to double inputs, and alerts that can be set for when the price crosses the bottom or top of the cloud.
This script also includes an ichimoku signal count. The signal count is an UNWEIGHTED sum of positive or negative ichimoku signals with the greatest total being shown in either green(long>short) or red(short>long) or white(0, long==short). The signal count is only shown when their is a new signal or a signal is no longer valid.
If you use a major portion of the code please cite me. If you like the script and make a bunch of money using it, feel free to donate using the crypto addresses below.
BTC: 34uVepgjGJAKqf9i3mfdq8AG1dzTthjCgb
ETH: 0x71B15Beb6AF985853B5fC80205ddb3595C51B63e
LTC: MVzvSu53K5qPfjiQn4nk9D6WVLJKCMzXHJ
DASH: XoKVDBnhiyPvJeyRdpHjcWu1WtVjCbhP68
XMR: 46jnYGp7v5vCSAV8pzGXPbWM7YFiZNB4eaFCHsezitQ46KM1E6FgPM9ZaYJEfDVk5zdKoPQ7vw27ke34jMxERogvJDQhfQW
Cerca negli script per "Ichimoku Cloud"

Ichimoku Cloud Strategy v2.0Trend following trading strategy “Ichimoku Crossover” is a popular Ichimoku trading strategy that uses the cloud and crossover of two base lines to define the market reverse point. Ichimoku crossover trading strategy has appeared to be a profitable trading strategy.
The indicator has 5 base lines and to read Ichimoku indicator it is required to understand the meaning of these lines first of all:
Tenkan-Sen line, also called the Conversion Line, represents the midpoint of the last 9 candlesticks . It is calculated with the following Ichimoku formula: .
Kijun-Sen line, also called the Base Line, represents the midpoint of the last 26 candlesticks . It is calculated with the following formula: .
Chiou Span, also called the Lagging Span, lags behind the price (as the name suggests). The Lagging Span is plotted 26 periods back.
Senkou Span A, also called the Leading Span A, represents one of the two Cloud boundaries and it’s the midpoint between the Conversion Line and the Base Line: . This value is plotted 26 periods into the future and it’s the faster Cloud boundary.
Senkou Span B, or the Leading Span B, represents the second Cloud boundaries and it’s the midpoint of the last 52 price bars: . This value is plotted 52 periods into the future and it is the slower Cloud boundary.
Trading with Ichimoku is very simple.
The Conversion Line needs to break above the Base Line. This will be a buy signal.
For a bearish (sell) signal a trader should wait for the Conversion line crosses the Base line downwards it is a sell signal.
Ichimoku Cloud ExIchimoko Clouds with vertical lines at the Conversion Period (default: 9), Base Period (default: 26) and Lagging Span B period (default: 52) as visual clues to the offsets.

Ichimoku all signalsIchimoku Cloud All Signals!
This indicator shows all Ichimoku Cloud signals for (entering/exiting/confirming/or even staying) in a position.
you can choose a signal related to your strategy and use it.
you can choose which signals to be shown on the chart by changing the settings.
here are some examples of signals that you can get from this indicator:
Crossover/under conversion line & base line
Crossover/under lead line1 & lead line2
Crossover/under conversion line & lead line1
Crossover/under base line & lead line1
Crossover/under conversion line & lead line2
Crossover/under base line & lead line2
Crossover/under close & base line
Cloud Breakouts in both directions!
and 74 signals more !!!!


Ichimoku Cloud strategy for gold marketThis strategy is based on main ichimoku features (Leading span , conversion line and base line) compared to cloud conditions.
I indicated all possibilities in this indicator and strategy decision is based on crossing factors of each main line through two other line confirmations.

Ichimoku Cloud (Auto Crypto/Non-Crypto settings)Save the hassle of switching back and forth between crypto and non-crypto settings by using the `syminfo.type` value under the hood.
If it's crypto it uses the 20, 60, 120, 30 settings, otherwise it uses 18, 52, 104, 26 defaults.
You can always override it using the Market Mode input in the settings.
The settings type is displayed in the top right of the chart as either "Crypto Cloud" or "Legacy Cloud" so you know which settings are being applied.

Ichimoku Cloud with Josh Olszewicz Crpyto Adjusted Settingslets you adjust your cloud to view higher timeframe cloud on lower timeframe by double or tripling timeframe

Ichimoku Cloud Signal ScoreAssociate various ichimoku signals with a score. For example, bullish signal => positive score, and bearish signal => negative score.
Signals from: ichimokutrader.com/signals.html
The scores of all the ichimoku signals are totalled up and plotted.

Ichimoku Cloud Anidjarcan be used in any timeframe
price crossing the cloud, buy or sell
blue line crossing red, attention to buy and sell
lagging line, inside prices, doing nothing, indicates trading, market consolidating.

Ichimoku Buy & Sell SignalsIchimoku cloud with color coded circles to signal the cross of Tenkan and Kijun.
Ichimoku Cloud betaThis is a test version of Ichimoku, instead of plot chiko span backward 26 bars, it draws price at 26 bars backward at the current bar.
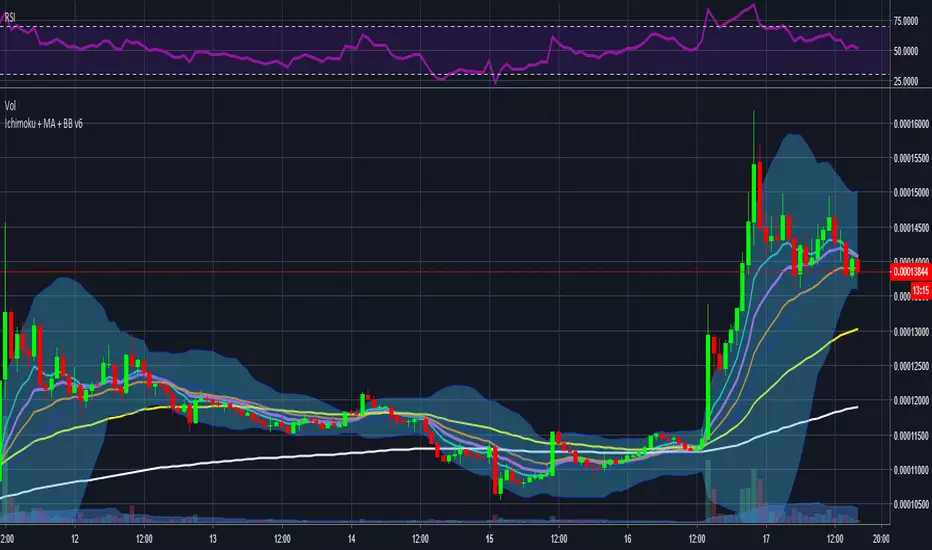
Ichimoku + Moving Average + Bollinger Bands v6Ichimoku cloud + bollinger bands + ema in one single script
Ichimoku_RSI_MACDIchimoku cloud + RSI + MACD. Combined indicators with signals, indicating whether it is bullish or bearish (BUY or SELL).

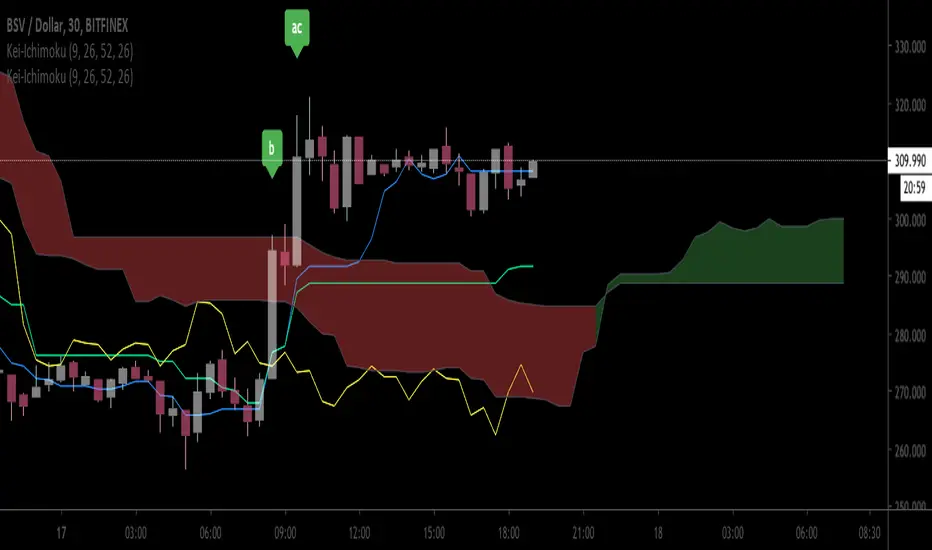
Ichimoku Cloud by Wei V1.3Label Sanyaku events, green for Gold and red for dead
- a: Tenkan sen Kijun Sen cross
- b: Chiko Span Cross Candle
- c: Kumo breakout
I also added a input option to draw chiko span differently. Original Chiko to draw Chiko as originally designed, and false to draw price at 25 bars earlier at current as "chiko span"

Ichimoku Cloud + EMA9,26instead of Base and Conversion, EMA9 and EMA26 is used to give more weight in recency of price movement